
Coverage’s reports are great but sometimes you want something more visual or a page you can share with other people.
Let’s see how to generate HTML reports from coverage.py.
Generate It
Instead of coverage report, run the following command.
coverage html
This will generate an HTML report. By default, it’ll live in the htmlcov/ directory.
If you enter this directory you’ll find your report ready.
Serve It
To serve HTML files (and CSS, JS, etc) directly from Python, we used the http.server module through:
python -m http.server
Output
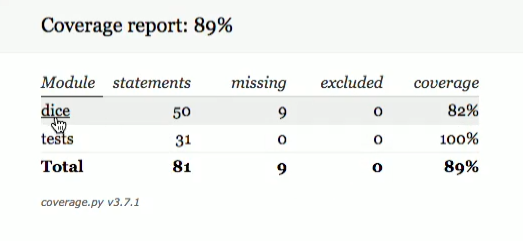
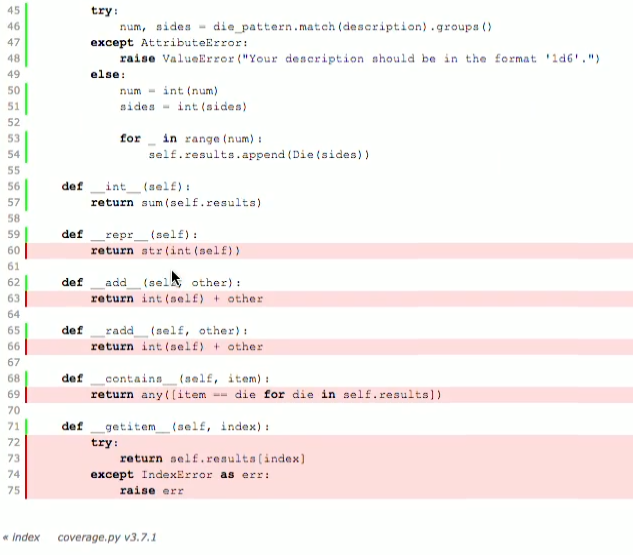
If you click on dice you’ll see the lines that are not covered in red.
Now if I had told coverage.py to skip certain lines. Then they’d be, they would appear in yellow.
Fix It
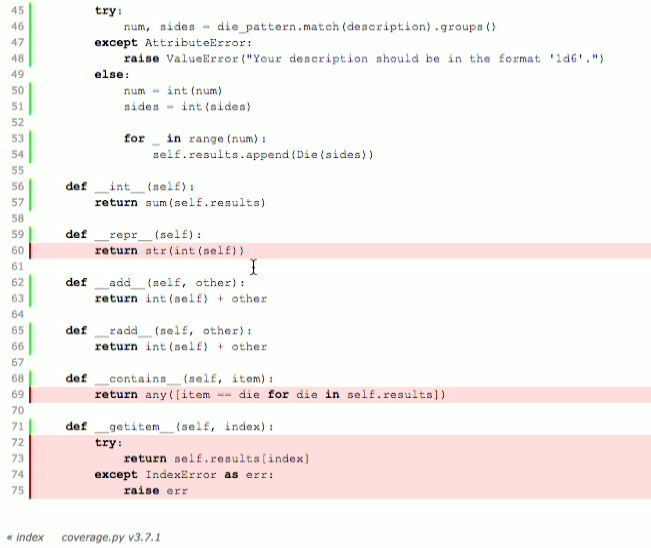
As you can see, we have a lot of things that aren’t really tested.
So, let’s write a test that does this. Add the following tests to your test.py file
class RollTests(unittest.TestCase):
    ...
    def test_adding(self):
        self.assertEqual(self.hand1+self.hand3,
            sum(self.hand1.results)+sum(self.hand3.results))
Run test
coverage run test.py
Generate HTML report for it
coverage html
Serve it in
python -m http.server
Access it through the browser
Output
Documentation
https://docs.python.org/3/library/http.server.html?highlight=http.server#module-http.server